Overview
This project implements a high-performance ETL (Extract, Transform, Load) pipeline designed to process large-scale online retail data. The system extracts raw transaction logs from Snowflake, processes them using Polars for high-speed in-memory transformation, and loads the cleaned data into Google BigQuery. The final output powers an interactive Looker Studio dashboard that tracks critical KPIs such as total revenue, order volume, and customer retention. This architecture ensures data consistency, scalability, and near real-time analytics readiness.
Data Extraction & Architecture
The pipeline begins by establishing a secure connection to a Snowflake data warehouse using a custom python client. Raw data—containing invoicing details, stock codes, and customer information—is fetched and immediately converted into Polars DataFrames. This choice of technology is crucial; Polars offers multithreaded query execution, making it significantly faster than traditional Pandas workflows for the heavy lifting required in the transformation phase.
Transformation: The Star Schema
To optimize the data for analytical querying, the raw dataset is transformed into a Star
Schema model
within the clean_data.py module. This process involves:
- Data Cleaning: Standardizing timestamps, casting types (Int64/Float64), and handling null values for customer integrity.
- Logic Segregation: Splitting the raw stream into two distinct Fact tables:
fact_sales(completed transactions) andfact_returns(cancellations and refunds). - Dimensional Modeling: creating distinct Dimension tables:
dim_products: Unique stock codes and descriptions.dim_customers: Customer IDs and country mapping.dim_date: A comprehensive date dimension breaking down invoices by year, month, day, and week.
Cloud Integration (BigQuery)
Once transformed, the pipeline utilizes the google.cloud.bigquery library to upload the
datasets.
The system employs a WRITE_TRUNCATE strategy, ensuring that the analytical tables
in BigQuery
always reflect the most up-to-date state of the transformed data without duplication. This seamless
integration
bridges the gap between raw python processing and enterprise-grade data warehousing.
Dashboard & Insights
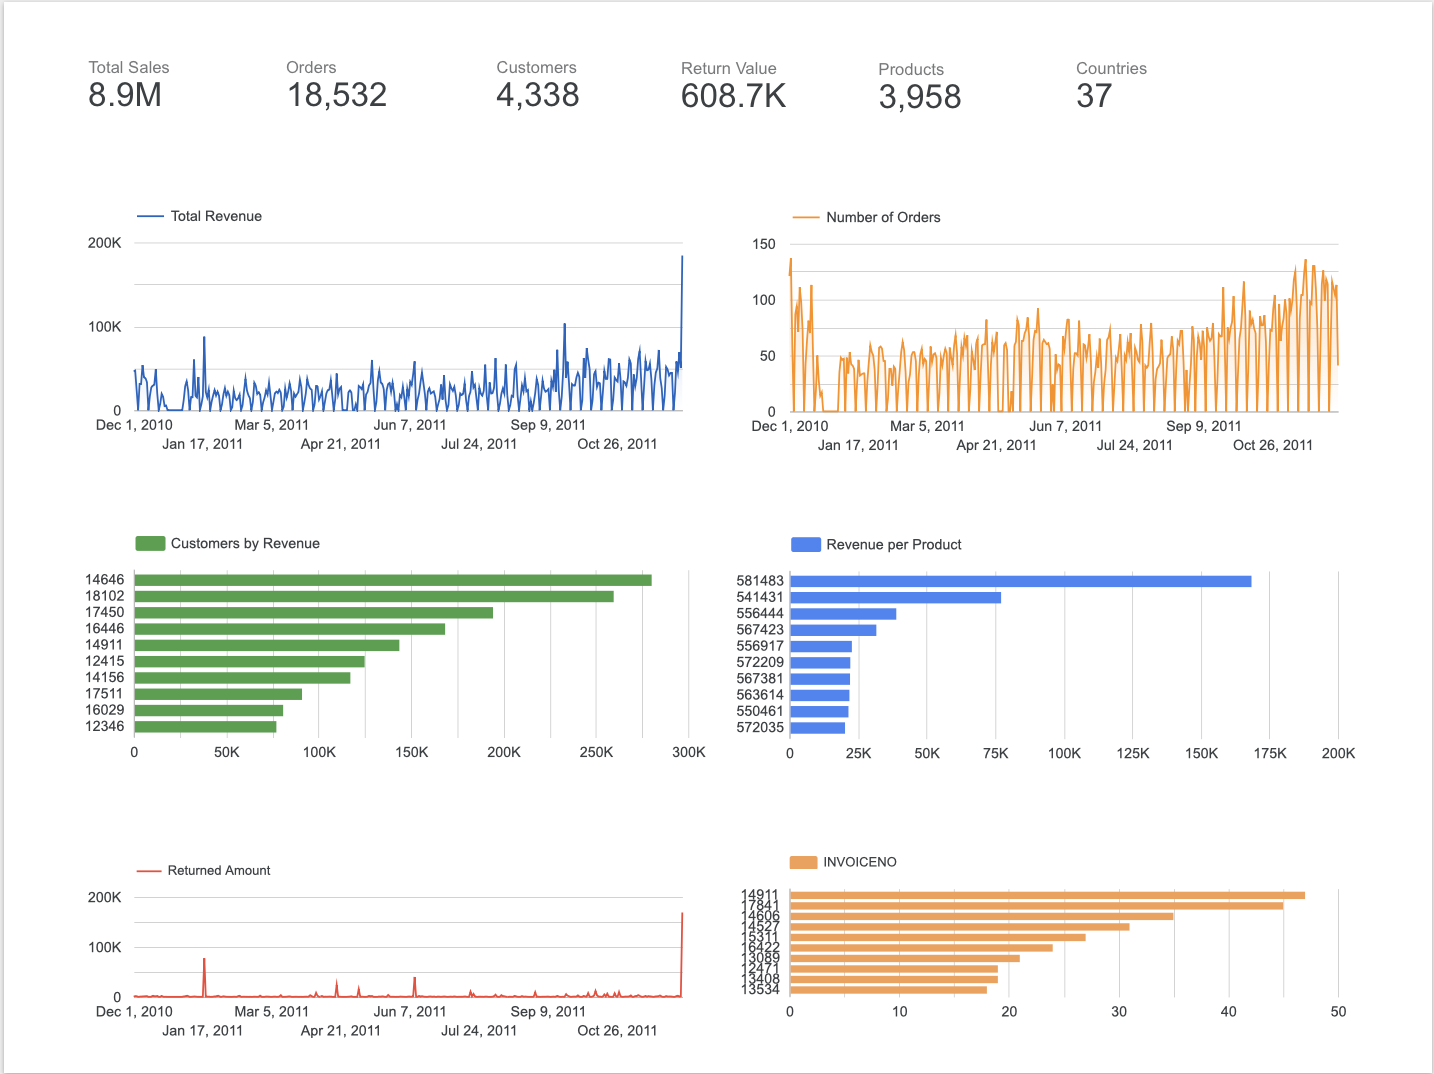
The processed data feeds into a Looker Studio dashboard, providing a comprehensive view of business performance. Key metrics visualized include a Total Sales volume of 8.9M and 18,532 distinct orders. The dashboard features trend lines for revenue over time, comparative bar charts for customer lifetime value, and a breakdown of revenue per product.
Conclusion
Building this pipeline reinforced my expertise in modern Data Engineering practices. By integrating Snowflake, Polars, and BigQuery, I created a solution that is both robust and scalable. The project demonstrates the ability to take raw, unstructured logs and convert them into actionable business intelligence, highlighting proficiency in schema design, cloud infrastructure, and data visualization.